


规格
技术文档
软件与工具
质量与封装
社区与支持
规格
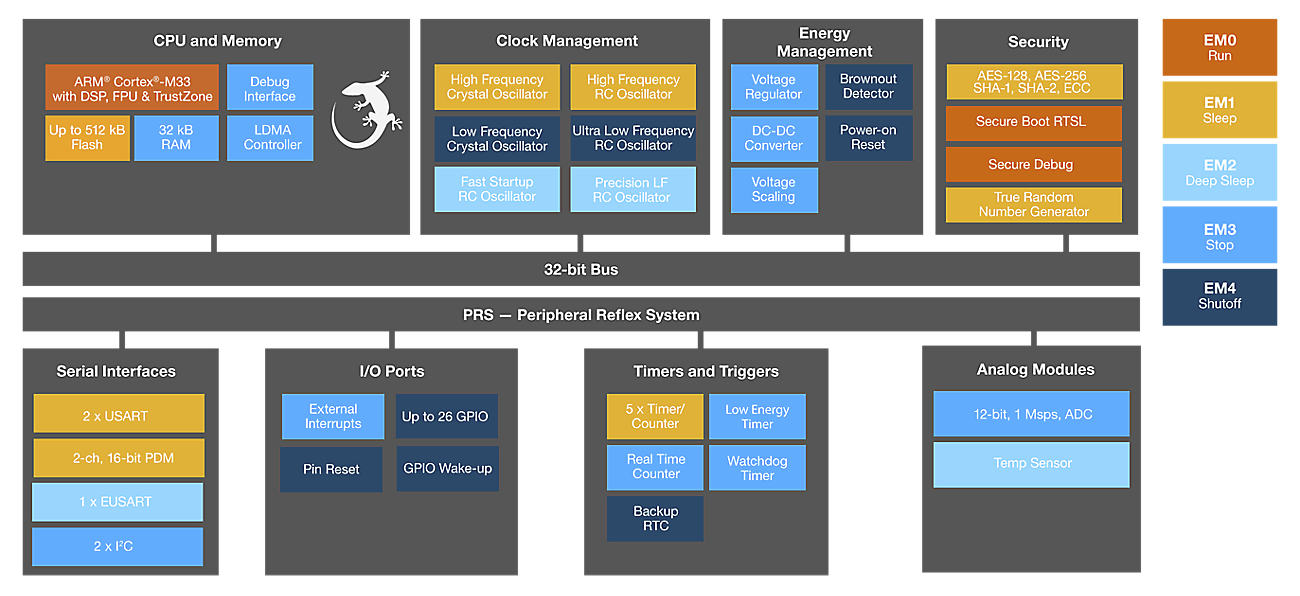
关键规格
|
核心频率
76
|
闪存
64
|
RAM
32
|
||
|
GPIO
18
|
ADC 分辨率
16
|
DAC
—
|
||
|
SPI
2
|
UART
3
|
I2C
2
|
||
|
计时器(16 位)
4
|
定时器(32 位)
2
|
封装
QFN32
|
||
|
核心频率
76
|
|
闪存
64
|
|
RAM
32
|
|
GPIO
18
|
|
ADC 分辨率
16
|
|
DAC
—
|
|
SPI
2
|
|
UART
3
|
|
I2C
2
|
|
计时器(16 位)
4
|
|
定时器(32 位)
2
|
|
封装
QFN32
|
技术文档
软件与工具
质量与封装
质量保证、环境和包装信息
上面显示的寿命日期针对此部件编号的首选版本,要获得部件编号版本的完整列表,请使用下面的搜索按钮。
作为其对供应连续性持续承诺的一部分,如果 Silicon Labs 自行确定供应链调整、产品改进、市场状况或类似的业务或技术问题使其有必要或可取,Silicon Labs 可以提供引脚兼容和功能等同的替代产品。
如果因为业务、技术或其他超出 Silicon Labs 合理控制范围的原因,使得 Silicon Labs 发现有必要终止产品,我们的政策规定我们将发出 EOL 通知,提供从通知发出之日起 6 个月的下达最终订单时间,以及从通知发出之日起 12 个月的最终发货时间。该政策符合半导体行业常用的 JEDEC 标准 EIA/JESD48。我们为产品的整个生命周期提供所需的支持。

查找并下载其他有关 Silicon Labs 设备的质量、环境、设备组成、测试结果、运输和供应链信息。
搜索结果将包括:
- 产品信息
- 包装信息
- 质量体系认证
- 财务信息
- 冲突矿产 (CMRT)
- 环境信息
- RoHS 合规认证
- REACH 声明
- 设备组成明细 (MDDS)
- MCD/FMD
- RoHS 合规认证
- 认证数据
- 贸易合规:ECC/HTS 代码
- 供应链信息
- IPC 1752-2 Class 6(XML 格式)
- ICP 测试报告
- 无卤素合规认证
- PFOS/PFOA 合规认证
- 供应保证函(长寿命)
社区与支持
How to debug standalone out files with Studio v5
In this article I will introduce that workflow, when only the out -built with debug symbols- and s37 files are available and needs to be inspected in studio.
Assumptions
It is assumed, the configuration in which the debug file produced is known, which in case of this article will be:
- SDK version, such as 2024.12
- Target hardware type such as BRD4186C (EFR32MG24B210F1536IM48).
And the hardware setup, in which the application needs to be debugged available and configured on both the out file producer and the out file consumer side.
NOTE
Debug target hardware environment used in this article assumes to have a Wireless pro kit from Silabs (WPK), which is connected to the computer through USB or available through network connection. This WPK will be debugger and the target is a BRD4186C board on WPK.
The out and s37 files are produced on the producer side, the out has debug symbols enabled optimization turned off and sent over to the consumer side with the s32 file.
Debug workflow
In this case the consumer should have the Silicon Labs Simplicity Studio v5 installed and same version of SDK installed on the computer.
NOTE
The SDK is a nice to have in case the source code needs to be looked up from sdk source files during debugging the out file.
Steps for set up debugging:
- Create a file system structure for the out file debug project.
- Create a debug project in studio.
2.1. Configure source file indexing if sources available - Create debug configuration.
3.1. Customize debug configuration
3.2. Disable compilation by default before start debugging.
1. Create file system structure for the out file debug project
This step is important even if you have a single out file, since studio, need to store the project configuration files somewhere. So it is recommended to create a folder that contains the project files and in a sub folder the out and s37 files shall be stored. In this example the folder structure presented on graph 1 is defined.
test_agent_zb_ble_dmp_brd4186c
    |
    |\
    | build
    |   |
    | Debug
    |   |
    |  test_agent_efx32.out
    |  test_agent_efx32.s37
    |
    | \
    |  .project, .cproject
    |
     \
       .settings
Graph 1. Project folder structure
The test_agent_efx32.out and s37 files are stored under build\Debug directory.
2. Create debug project in Studio
First start the studio and select File->New->Other.. see it shown on picture 1.
Picture 1. Create new project dialog.
In the project wizard check the "Show All Wizards." checkbox and select "C Project"and hit next, see picture 2. After hitting the next button a new dialog opens up and indicating that "This action requires the enablement of CDT - New C/C++ Project Wizards. Enable the required activity?" Hit OK for this question.
Picture 2. Create mew C project dialog.
On C Project configuration dialog (picture 3.) select "Silabs ARM Executable" as a project type and uncheck the "Use default location" checkbox. Browse for your out file project root folder. In the demo case it is "test_agent_zb_ble_dmp_brd4186c" as it is indicated on graph 1. Give a name for your project, which is in this case called as "ble-zigbee-test-agent-dmp-trial". After you clicking on the Finish button a dialog pop up "Open the C/C++ Perspective?", click on the "Open Perspective" button.
Picture 3. Create Silabs ARM Executable project dialog.
If all that is configured, than click the Finish button and you are done with setting up the project. Now you can go forward to create a new debug configuration chapter, or if you get sources with your out file, you can configure sources.
2.1. Configure source file indexing if sources available
If source files are added with the out file and the related SDK version also available, than these can be linked with the project, so it is possible to check the source code when the break point is hit. Select Project->Properties and select "C/C++ General"->"Paths and Symbols" and from the tabs click on the "Source Location". See Picture 4. Here on the right click on the "Link Folder..." button. Check the "Link to folder in the file system" check box on the dialog and Browse for the GSDK folder. In the example it is in the "gsdk_2024_12_main" folder and hit ok. Do not forget to click Apply and Close. If you copied the source files into the project root folder -before you created the Studio project- that it will be already recognized by the project, there is no need to link it separately.
Picture 4. Link paths to project.
When all the source files are available, and SDK is linked with the project, than only the indexer needs to be configured, to index the files. See picture 5 for configuring the indexer. Select Project->Properties->"C/C++ General"->Indexer, and here check the "Enable project specific settings" and check "Enable indexer". Select what ever index options that you prefer.
Picture 5. Configure the project specific indexer.
3. Create debug configuration
Hint
The easiest way for creating a debug configuration is to copy an existing one. If there are no debug configuration in your environment yet, just create one standard project through the launcher against your hardware configuration and start debugging it, so it will auto create a debug config, that can be copied later on.
Right click on the project name and select "Debug As"->"Debug Configuration" See the dialog on picture 6..
Picture 6. Create debug configuration dialog.
In debug configuration dialog (picture 7) You can create new configuration or if there is an existing one you can make a copy of that and modify. In the case indicated here, there is no debug configuration available, so new needs to be created. Once the new configuration is ready or an existing one is copied, than is should be customized for the project needs as it described under chapter 3.1.
Picture 7. Configuring the gdb jlink debug configuration type.
3.1. How to customize debug configuration
On the main tab of the new debug configuration change the project name and browse the location of the out file. (pciture 8.) On the other tabs no changes are required, except the device type that should be adjusted according to the target device configuration. In case of need adjust the device type on the "Debugger" tab. (EFR32MG24B210F1536IM48)
Picture 8. Customizing the debug configuration.
3.2. Disable compilation by default before start debugging.
When debug session is started it can trigger an auto application build, which in case of imported project can lead to overwriting the out file. This auto build can be disabled through project preferences. On "Run/Debug"->Launching dialog uncheck the "Build (if required) before launching" option. (See picture 9)
Picture 9. How to disable auto build before launch.
Debug Adapter Firmware Update Requires repeated update attempts
When a new version of a debug adapter firmware (fw) is available, Simplicity Studio (SSv5) will show a message asking if the user wants to update to the latest firmware version. When the update is selected it will sometimes fail, especially on Windows, usually with a timeout message. Silicon Labs is working on providing a fix to the issue through a combination of Simplicity Studio and Simplicity Commander updates (Simplicity Commander is used for all adapter fw updates, even through SSv5). Until a fix is available, the following procedure can be used to update the adapter firmware.
1. From the [Tools] menu, open Simplicity Commander.
2. Exit Simplicity Studio, but keep Simplicity Commander open. Simplicity Studio inadvertently interferes with the update process when the debug adapter is reset in bootloader mode.
3. In Simplicity Commander, click the [Select Kit...] button and then select the debug adapter to update. If an earlier adapter firmware update attempt failed, there may be a popup about the adapter being in 'bootloader mode', that is fine, just ignore the message and hit the [OK] button and proceed with the next step.
4. The [Kit] section of commander should be selected. In the [Update Kit] section click the [Browse...] button to find the update image to use. The various adapter firmware images for the debug adapter types that have been attached to the computer will have been automatically downloaded to the 'offline/hwtools/firmware' folder in the SSv5 installation folders (under Contents/Eclipse on MacOS). If only one adapter type has been attached, then there will only be one folder and the latest file in the folder should be selected. But there could be several adapter firmware folders from amongst this set:
Note: If the wrong adapter firmware image is selected it will not hurt anything as that will be detected and the update will be aborted. So, in the worst case a trial and error approach can be used.
The various adapter firmware images exist because there are different board controller processors on the various debug adapters. The following is a guide for which adapter firmware group (examples S1015B, S1015D, S1015E, S1015F) should be used for the various Silicon Labs debug adapters.
S1007 - Older EFM32 development kits with 'DK' in part number
S1010 - EFM32 based starter kits, BRD2001A, BRD2100A
S1012 - BRD3201A, BRD3201B
S1014 - EFM32 based starter kits, BRD2010A, BRD2200A, BRD2201A, BRD2400A
S1015A_mcu_stk - EFM8 and EFM23 based starter kits, BRD5000A, BRD5001A, BRD5100A,
BRD5101A, BRD5200A, BRD5201A, BRD5202A, BRD5300A, BRD2012A, BRD2102A,
BRD2204A, BRD2204B, BRD2500A, BRD2501A
S1015B - Wireless mainboard BRD4001A and BRD4001B, also known as 'WSTK'.
S1015C - Thunderboards, BRD4160A, BRD4166A, BRD4166C, BRD5002A
S1015D - For the various small 'devkits' such as Thunderboards and the 26xx boards.
BRD1015A, BRD2503A, BRD2503B, BRD2600A, BRD2601B, BRD2602A,
BRD2603B, BRD2605A, BRD2608A, BRD2700A, BRD2701A, BRD2702A,
BRD2703A, BRD2704A, BRD2705A, BRD2710A, BRD2900A, BRD2901A,
BRD2902A, BRD2903A, BRD2904A, BRD2905A, BRD4108A, BRD4184A,
BRD4184B, BRD4314A, BRD4330A, BRD4331A
S1015E - Wireless pro kit - BRD4002A, also known as 'WPK'.
S1015F - Pro kit, EFM8 and EFM32 based 'B' and 'C' variant boards,
BRD2001B, BRD2010B, BRD2012B,
BRD2100B, BRD2102B, BRD2200C, BRD2201B, BRD2204C, BRD2400B,
BRD2500B, BRD2501B, BRD2504A, BRD5000B, BRD5001B, BRD5100B,
BRD5101B, BRD5200B, BRD5201B, BRD5202B, BRD5206B, BRD5207B,
BRD5208A, BRD5300B,
After opening the latest file in the appropriate folder, click the [Install Package] button. The progress of the update can be tracked in the Log Window. If the update fails, then close any dialog boxes and try again with the following two notes:
1. If an EMLINK failed message is received, then disconnect and reconnect the debug adapter before trying again.
2. If the blue LED near the USB connector is flashing fast (this has only been observed sometimes on Windows), then wait for the flashing to stop before trying again. My observation is that if the blue LED starts flashing for a long time when a debug adapter is connected, then rebooting the PC will resolve that issue.
The above procedure has worked every time it has been tried, sometimes it might take up to 4 or 5 attempts to update the firmware.
This issue will be fixed with the Simplicity Studio SV5.10.0 and Simplicity Commander 1v17p0 release.
How to use Ozone IDE for SiW917 debugging?
To debug using the Ozone IDE, please follow the instructions below.
Prior to debugging, please make sure you flash the firmware, that you wish to debug, using Simplicity Commander.
Link to flash the firmware: https://docs.silabs.com/wiseconnect/latest/wiseconnect-getting-started/getting-started-with-soc-mode#upgrade-si-wx91x-connectivity-firmware
Settings:
-
Install Ozone using this link: https://www.segger.com/downloads/jlink/#Ozone
-
Download "sl_siw917.jdebug" and "SiWx917.svd" files from this given link: https://www.silabs.com/Wi-Fi_I&C_Apps/Ozone/Ozone.zip
-
Unzip the downloaded folder.
-
Settings in"sl_siw917.jdebug" file should be done appropriately as mentioned below:
Where,
Project.AddPathSubstitute ("C:\Users\SimplicityStudio\workspace\wifi_powersave_standby_associated_soc", "$(ProjectDir)"); // Please provide the path of the folder.
Project.SetHostIF ("USB", "440270093"); // Check for this number using Simplicity Commander as shown in the below image:
Project.AddSvdFile ("C:\Users\Downloads\SiWx917.svd"); // Use the SVD file: SiWx917.svd
File.Open ("C:\Users\Downloads\wifi_powersave_standby_associated_soc.axf"); // Optional to add the *.axf file.
-
Connect your board and make sure it is in "MCU" Debug mode in Simplicity Commander.
-
Open Ozone IDE and click on "Next" button on the popup as shown below:
-
Now in Emulators connected via USB section, select your board and click on "Next" button.
-
Either click on "Next" Button or Browse the *.axf file. This is optional step.
-
Keep the default settings as is, in "Optional Settings" and click on "Finish" button.
-
Make the changes as shown below in "Project Load Diagnostics" and click on "Continue" button.
-
Now Click on "File" section and select "Open" option:
-
Now browse the "sl_siw917.jdebug" file and select it.
-
Another popup would automatically be prompted, browse and select the *.axf file for debugging
-
Click on "Attach & Halt Program"
-
Click on "Reset & Break at Symbol"
- After the 11th Step, the pointer will be at main() function:
Above are the steps which can help one to debug SiW917 using Ozone IDE.
